Nav-Studio
Home
Products
Services
Tools
Imprint


SatNavAnalyser
SatNavAnalyser is a SW-tool for GNSS data analyses.
SatNavAnalyser is intended to support experts as well as students in their evaluation and analyses of satellite raw data and positioning. The multiple visualisation capabilities allow a swift generation of comparing time-series presentations or statistics.
SatNavAnalyser allows comprehensive GNSS data analyses in different domains, among them statistical analyses raw-data as well as analyses in position domain up to service-volume and
integrity investigations. All RINEX (and few other) file formats are
supported. Special consideration is put on visualisation capabilities and easy usability. This way, data analyses can be done efficiently. Automatic data evaluations are supported. A multi-GNSS positioning
functionality (absolute and differential) is also included.
Please send your request to: contact@nav-studio.de
Functionalities
Data analyses
- Analyses in raw data domain (pseudo-ranges, carrier-phases, Doppler, C/N0, CmC, etc.)
- Analyses in navigation data domain (satellite positions, change of ephemeris, theoretical DOP values)
- Analyses in position data domain (trajectories, position error components)
- Analyses in meteo data domain (pressure, temperature, wind speed and direction, etc.)
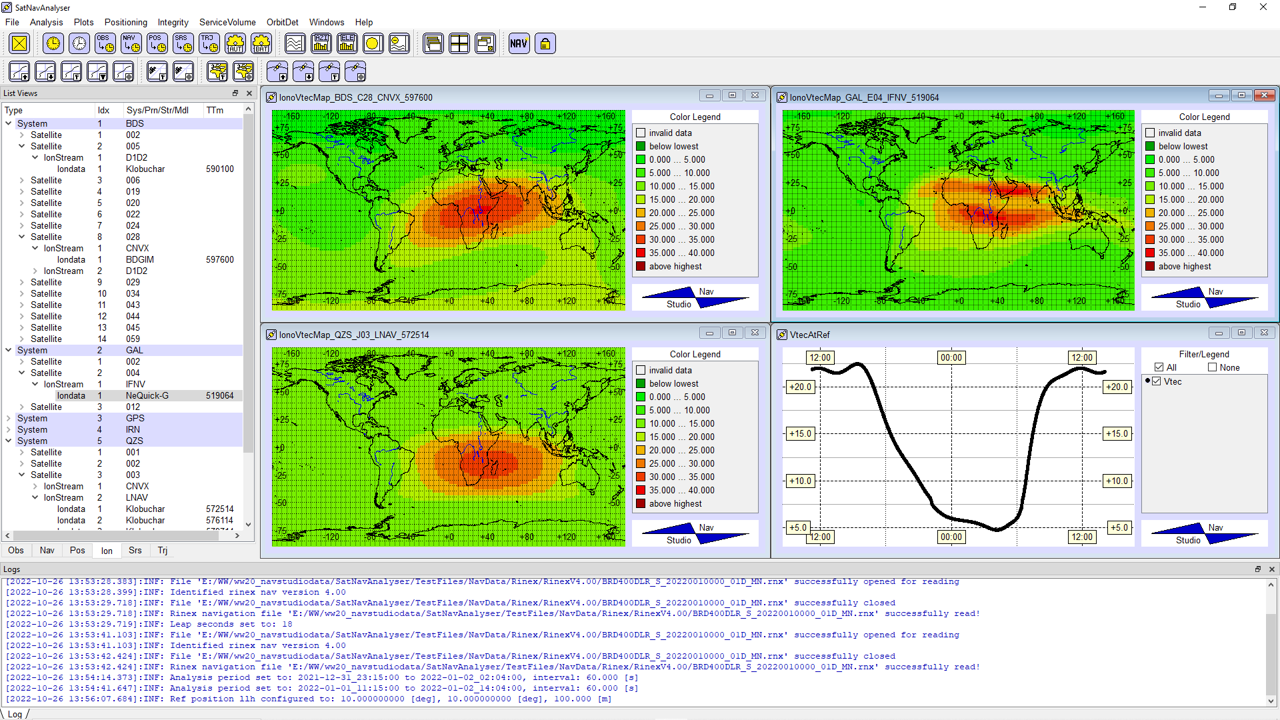
- Analyses in ionospheric data domain (all GNSS models: Klobuchar, NeQuick-G, BDGIM)
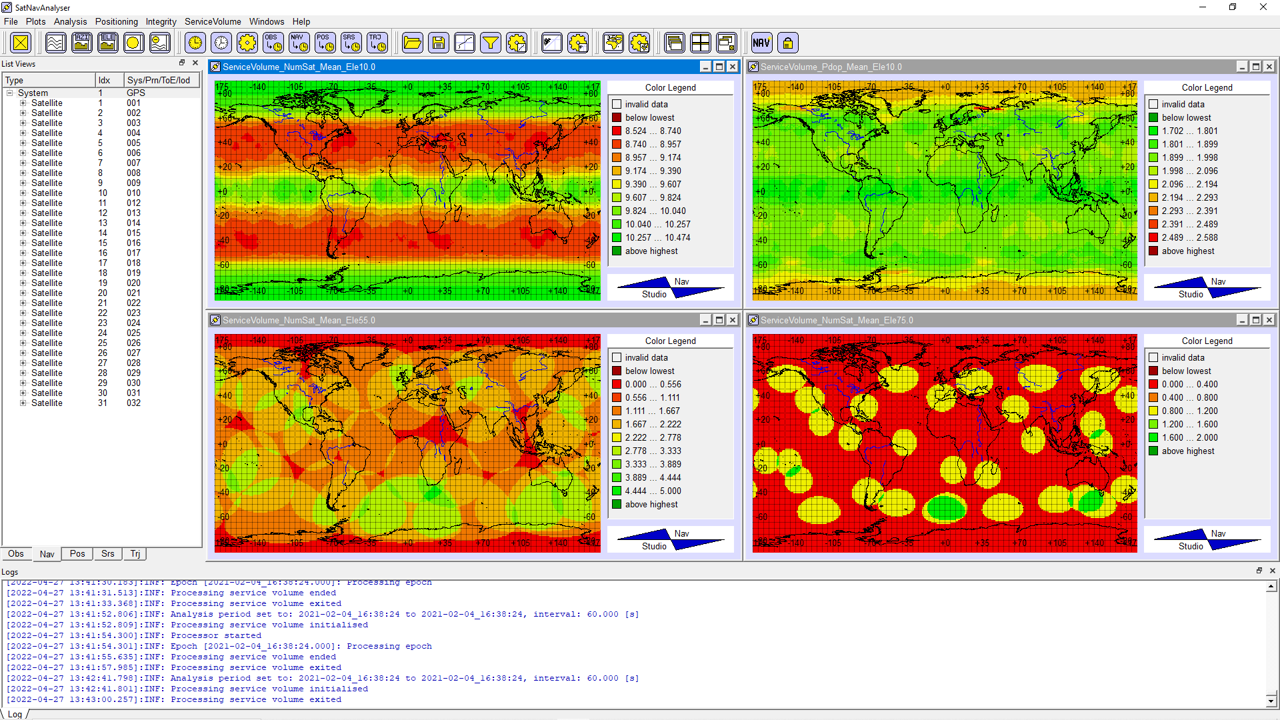
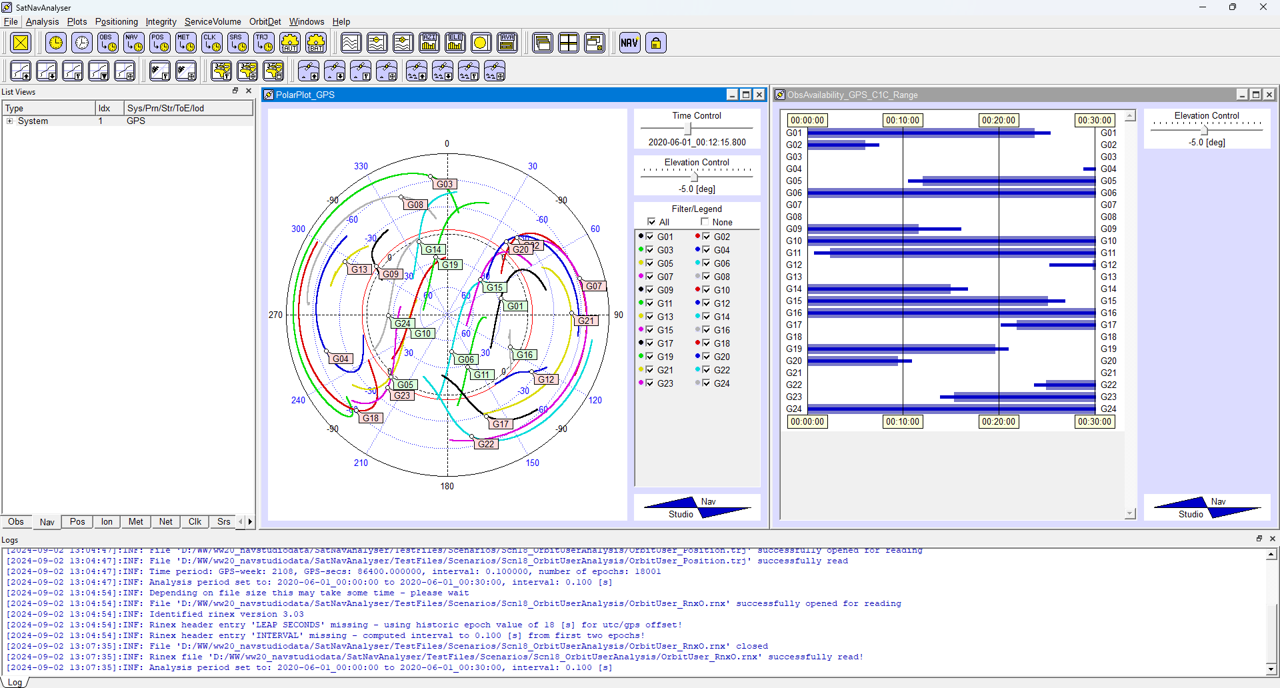
- Analyses in service-volume domain (number of visible satellites, PDOP, HDOP, VDOP, availability)
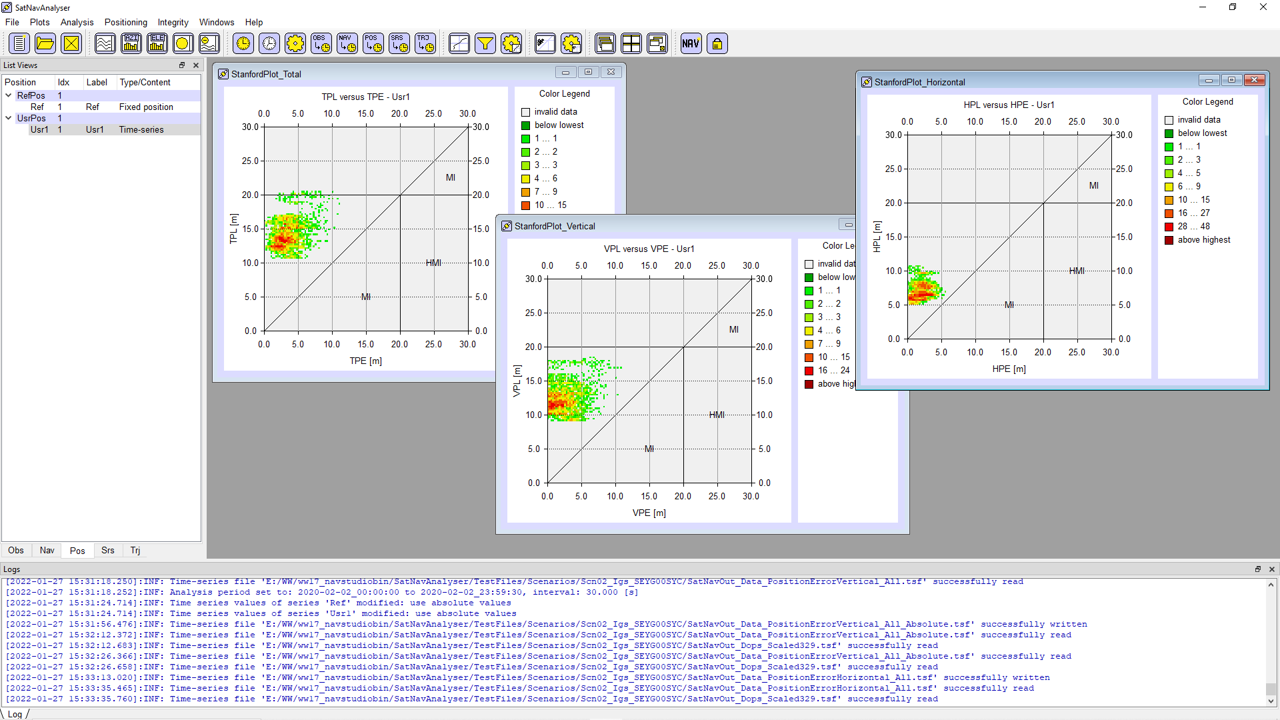
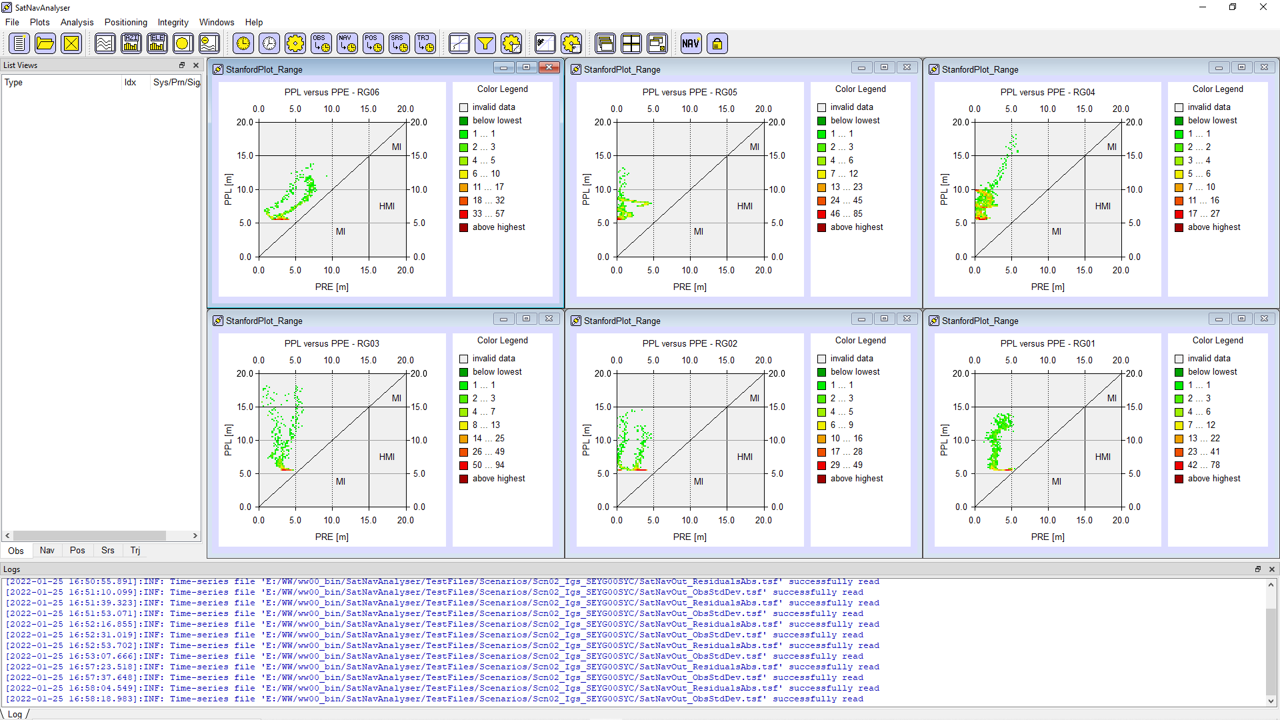
- Analyses in integrity domain (via Stanford plots)
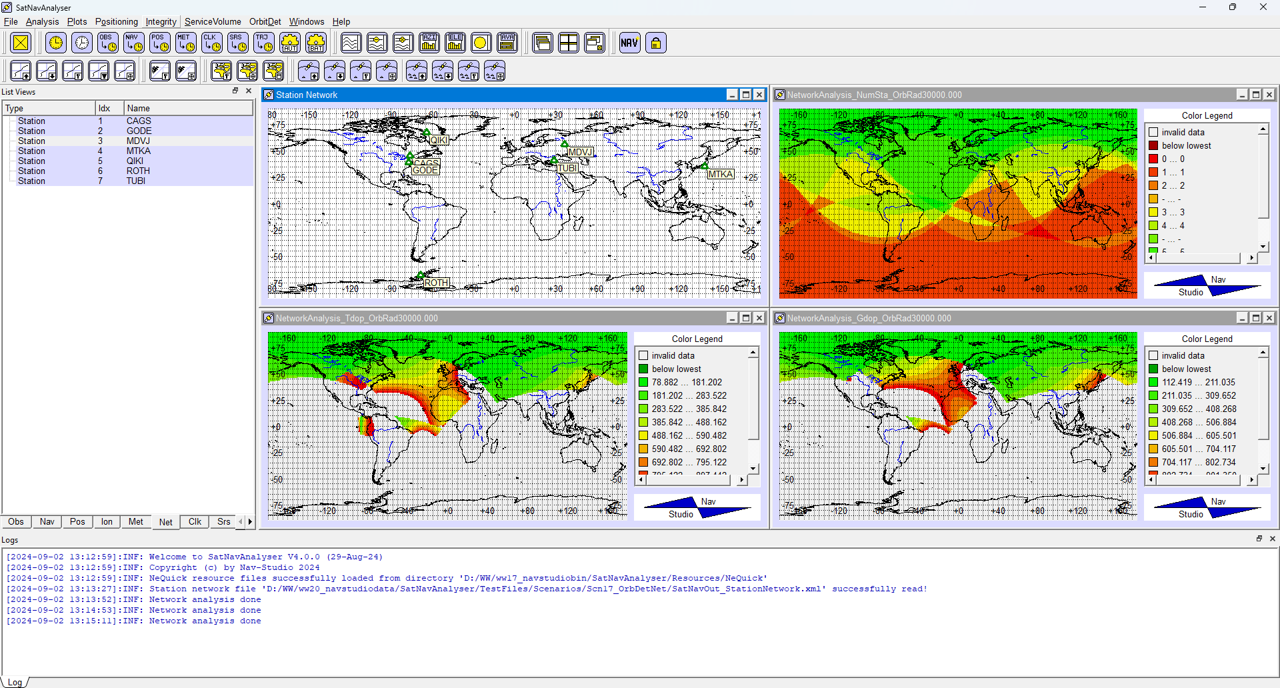
- Analyses of ground-station networks
Visualisations
- Visualisation of data time-series
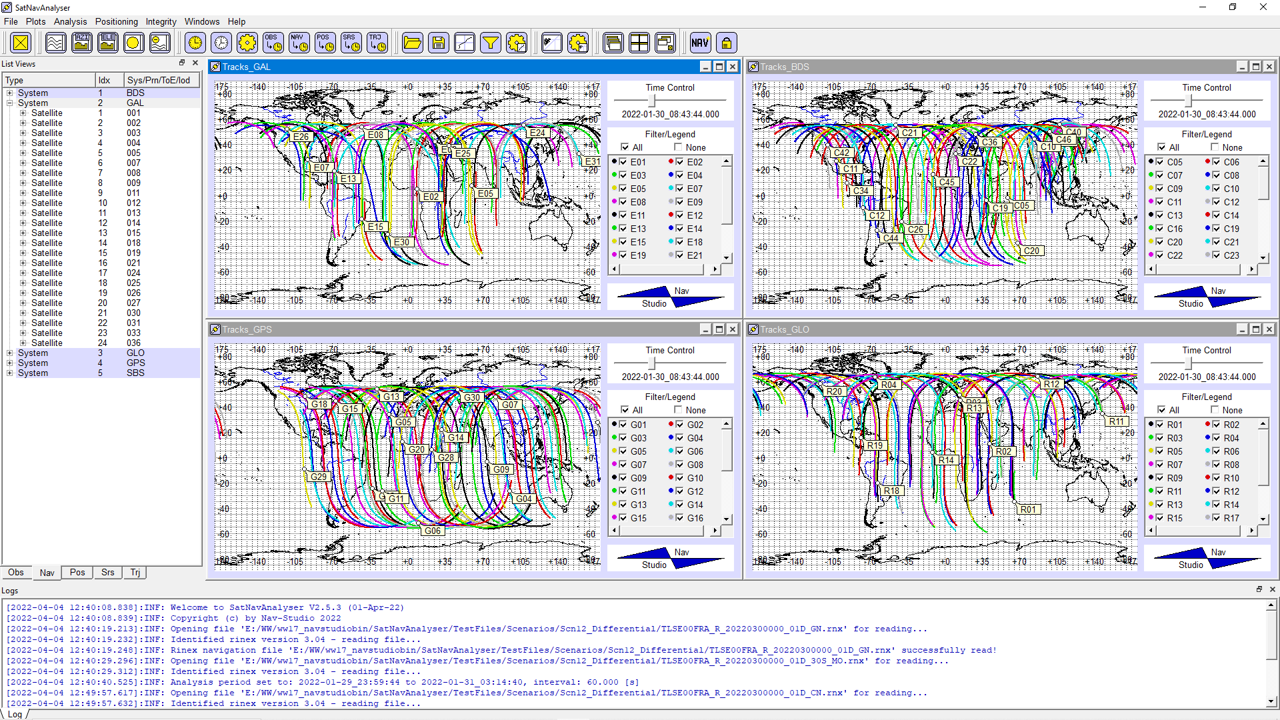
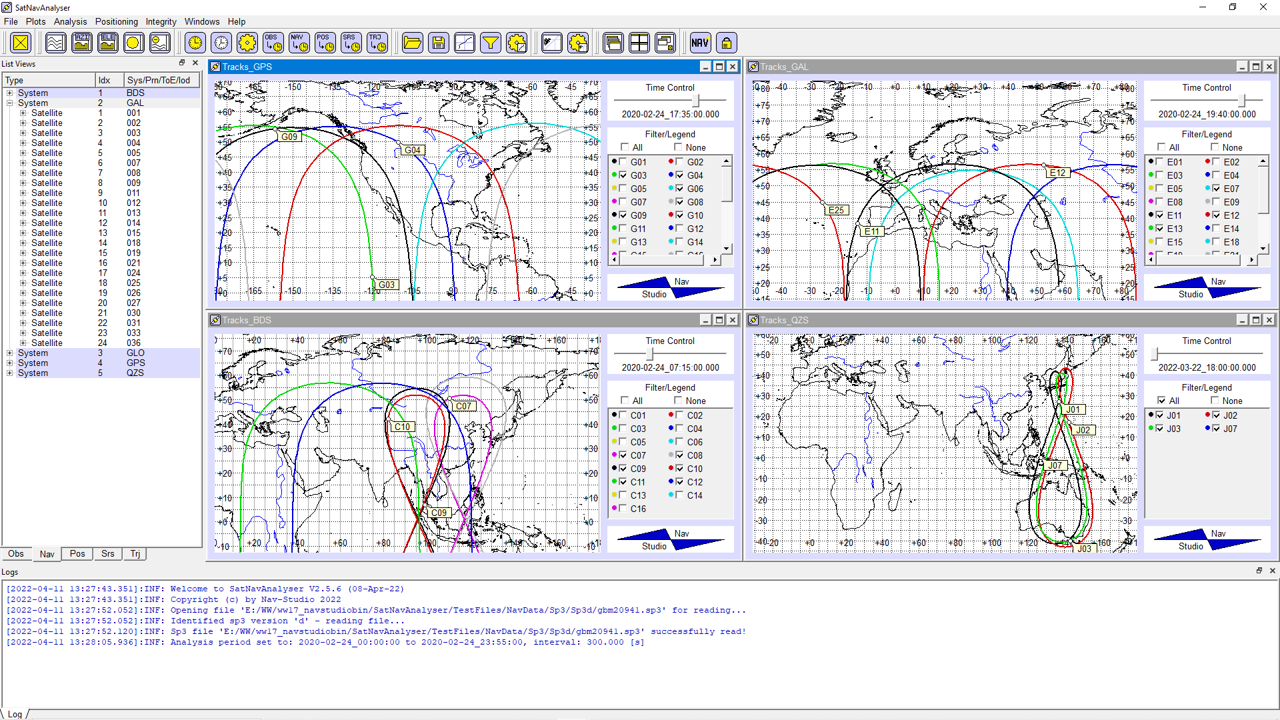
- Visualisation of satellite constellations on a zoom-able world map
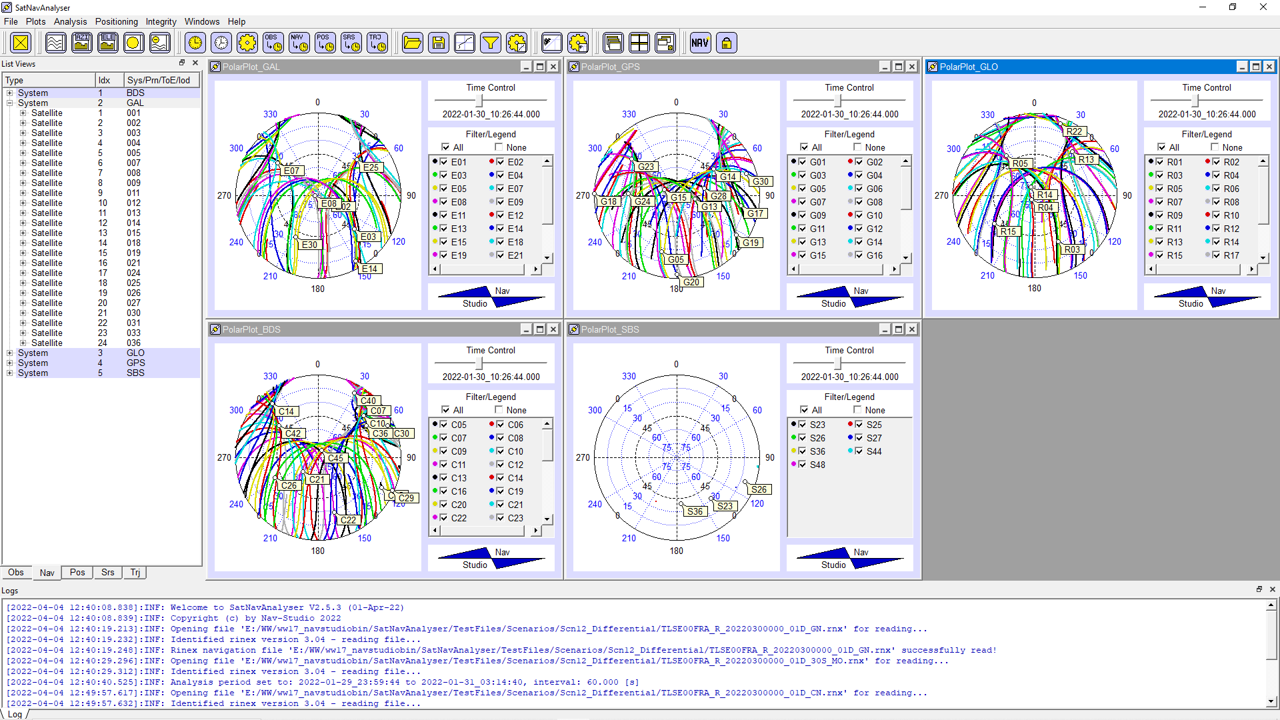
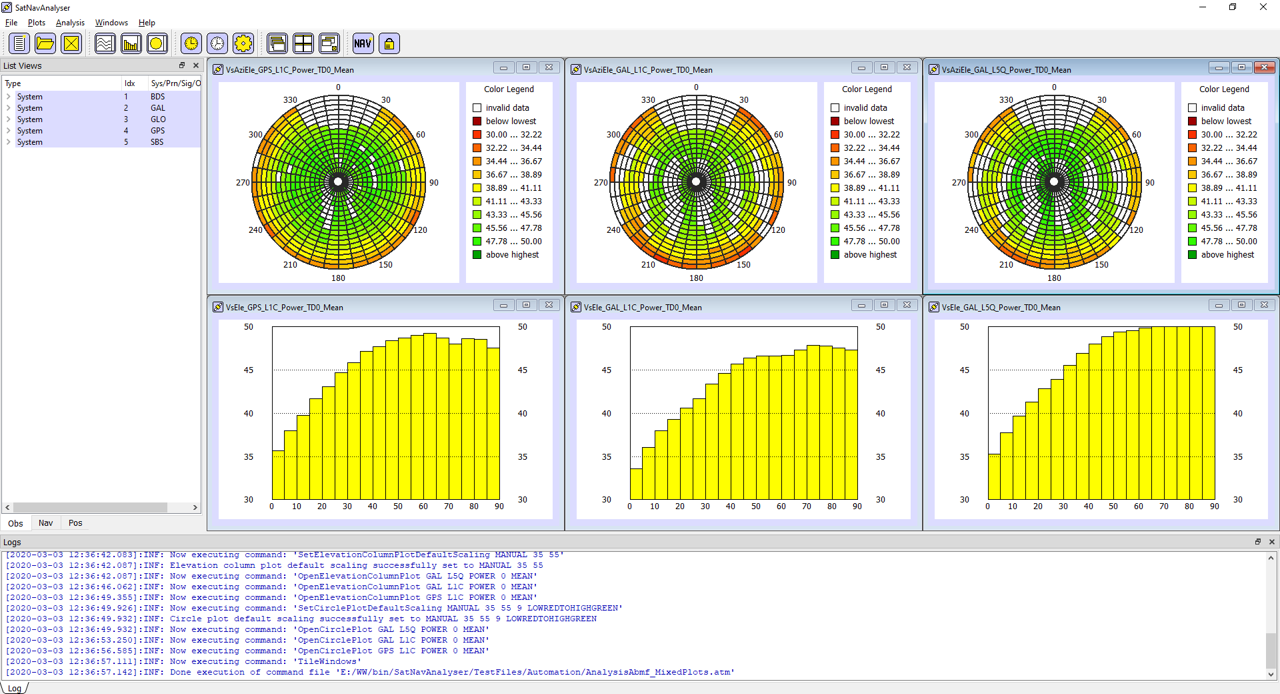
- Visualisation of user/satellite polar plots (allowing also dynamic and orbital users)
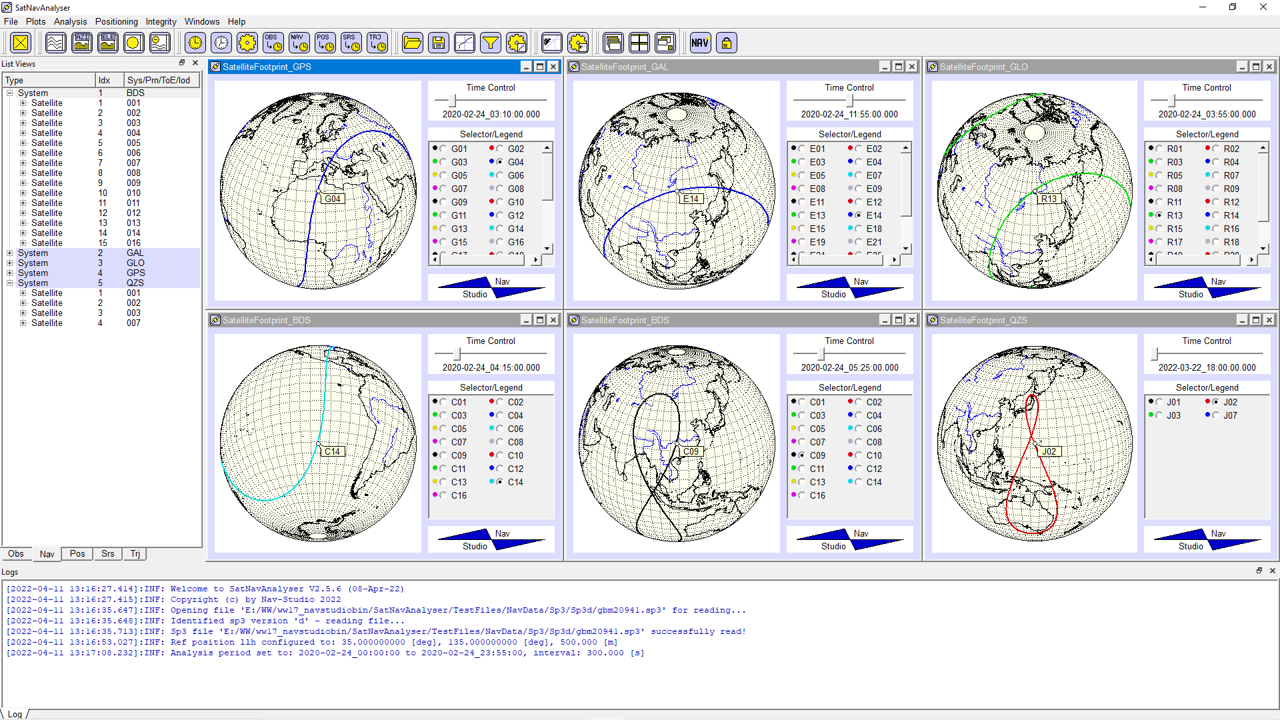
- Visualisation of satellite footprints
- Visualisation of service-volume results on a zoomable map
- Visualisation of satellite visibility and observation availability
- Generation of data statistics and histograms over single or multiple time series
- Correlation of data and statistics versus azimuth and/or elevation
Input/output data formats
- Support of RINEX-obs files (input and output, all format versions up to V4.02)
- Extended (but compatible) RINEX-obs format in support of customized signals
- Support of RINEX-nav files (input and output, all format versions up to V4.02)
- Support of RINEX-met files (input and output, all format versions up to V4.00)
- Support of RINEX-clk files (input and output, all format versions up to V3.04)
- Support of SP3 orbit and clock files (input and output, format versions SP3c and SP3d)
- Support of GALILEO XML almanacs
- Support of YUMA and SEM almanacs
- Support of all GNSS systems as defined in RINEX: GPS, GLONASS, GALILEO, BEIDOU, QZSS, IRNSS, SBAS
- Support of a pre-RINEX standardfor LEO systems
- Support of all observation types as defined in RINEX-obs V4.02
- Support of all navigation data streams as defined in RINEX-nav V4.02
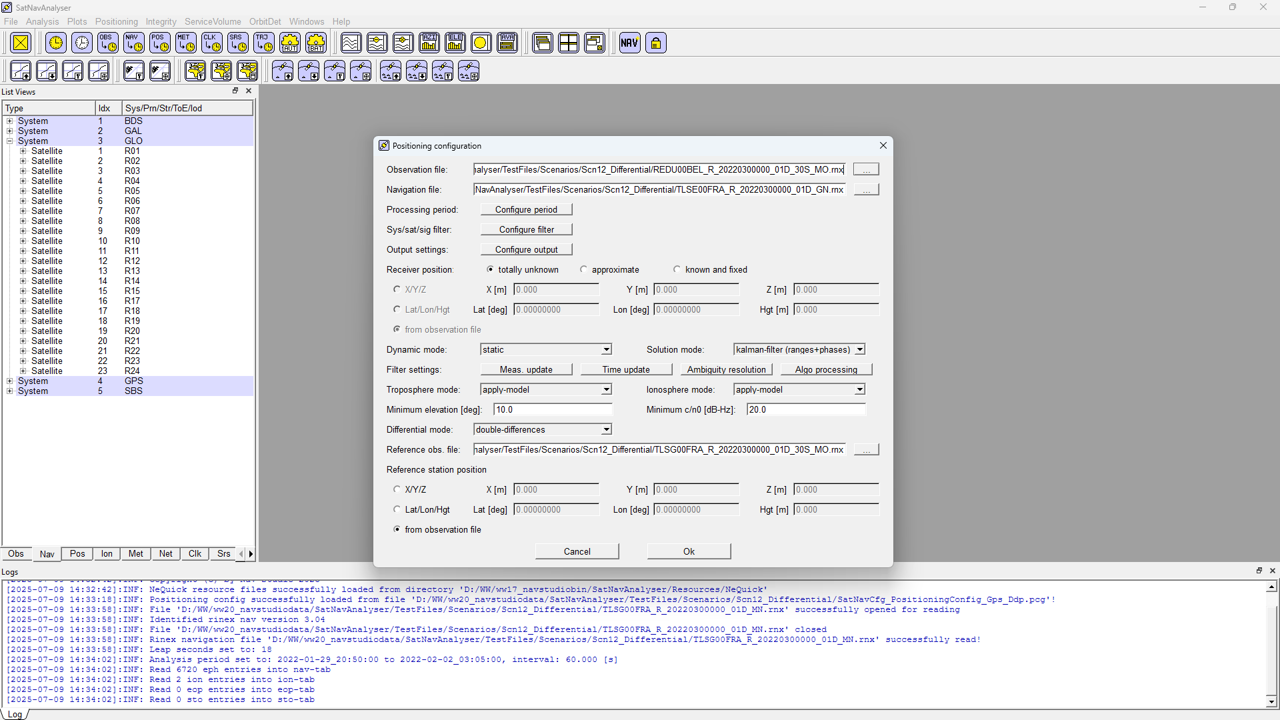
Positioning
- Multi-GNSS single-point positioning (static and kinematic)
- Differential multi-GNSS positioning (single or double differences)
- Optional usage of carrier-phases when positioning with kalman-filter ('float' solution)
- High-precise positioning ('fixed' solution)
- Detailed configuration capabilities (measurement update/time update, sigma values, etc.)
- Differential positioning with moving reference station
Automation
- Automation of analyses
- Automatic observation data analyses in HTML-format, see analysis-example
- Automatic positioning processing
Example Screenshots
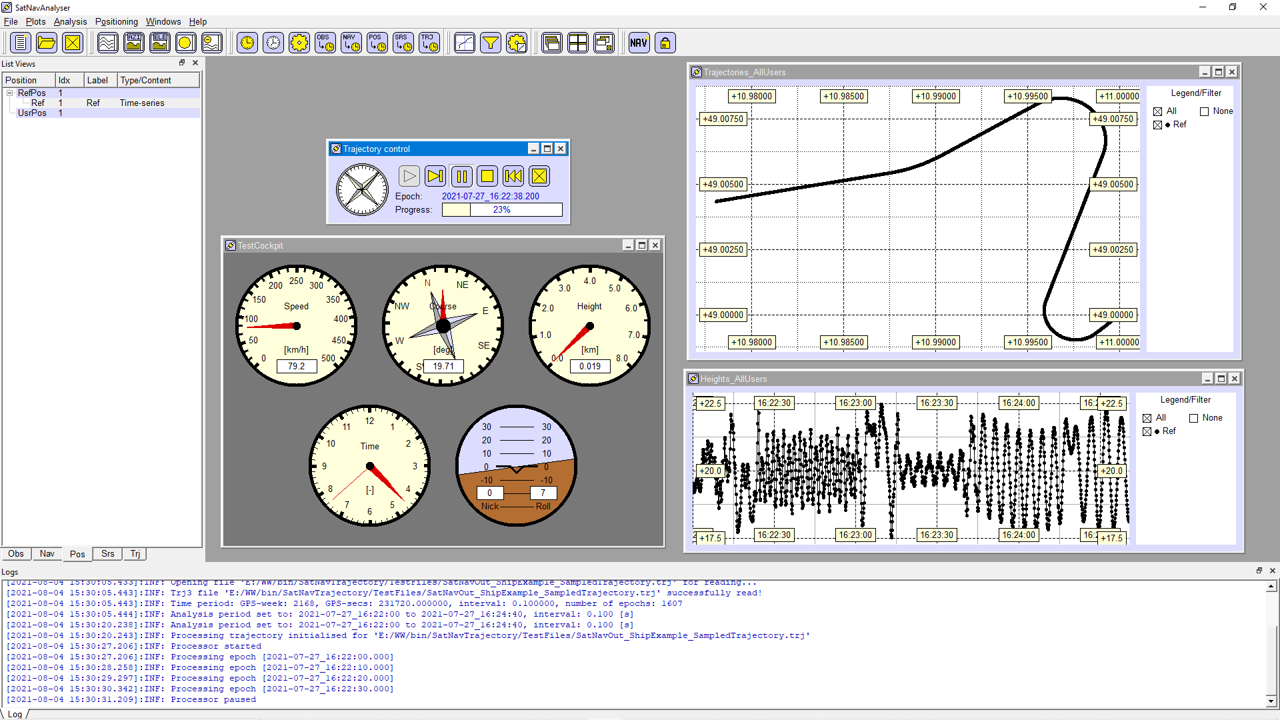
The user-friendly interface allows an efficient data analysis.
For example, time differences or integrals of time series can be computed with few mouse clicks.
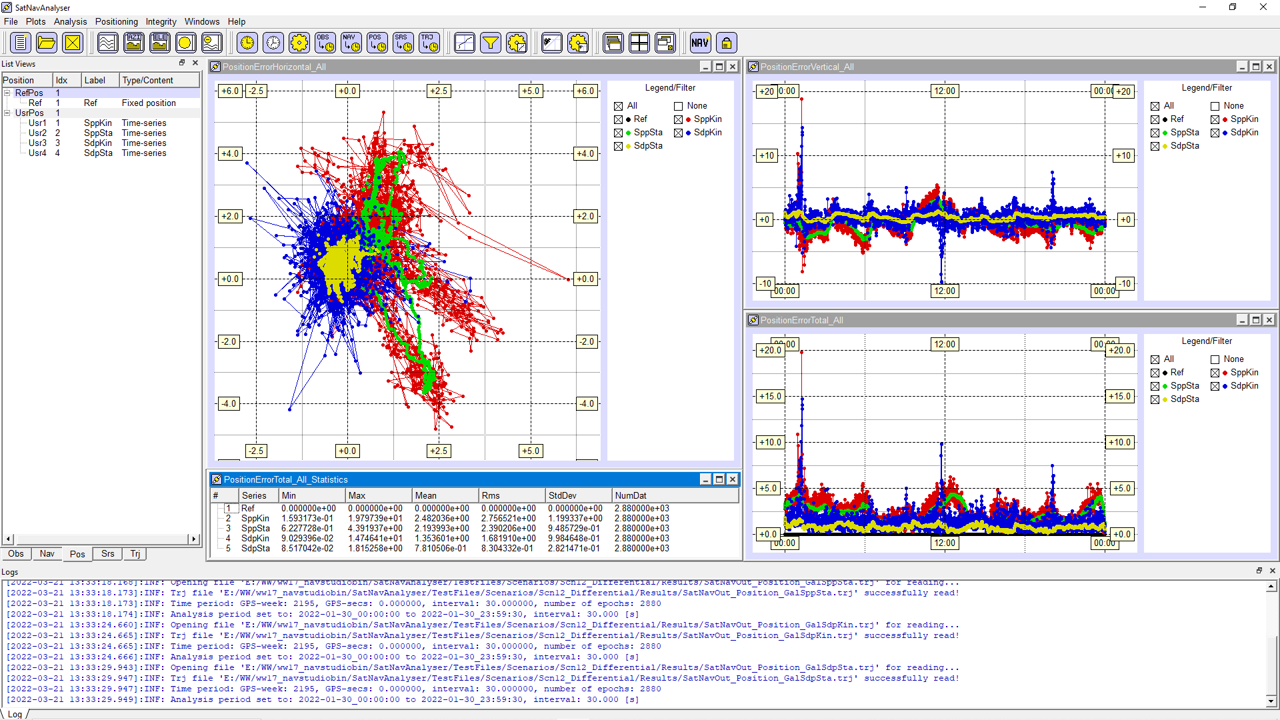
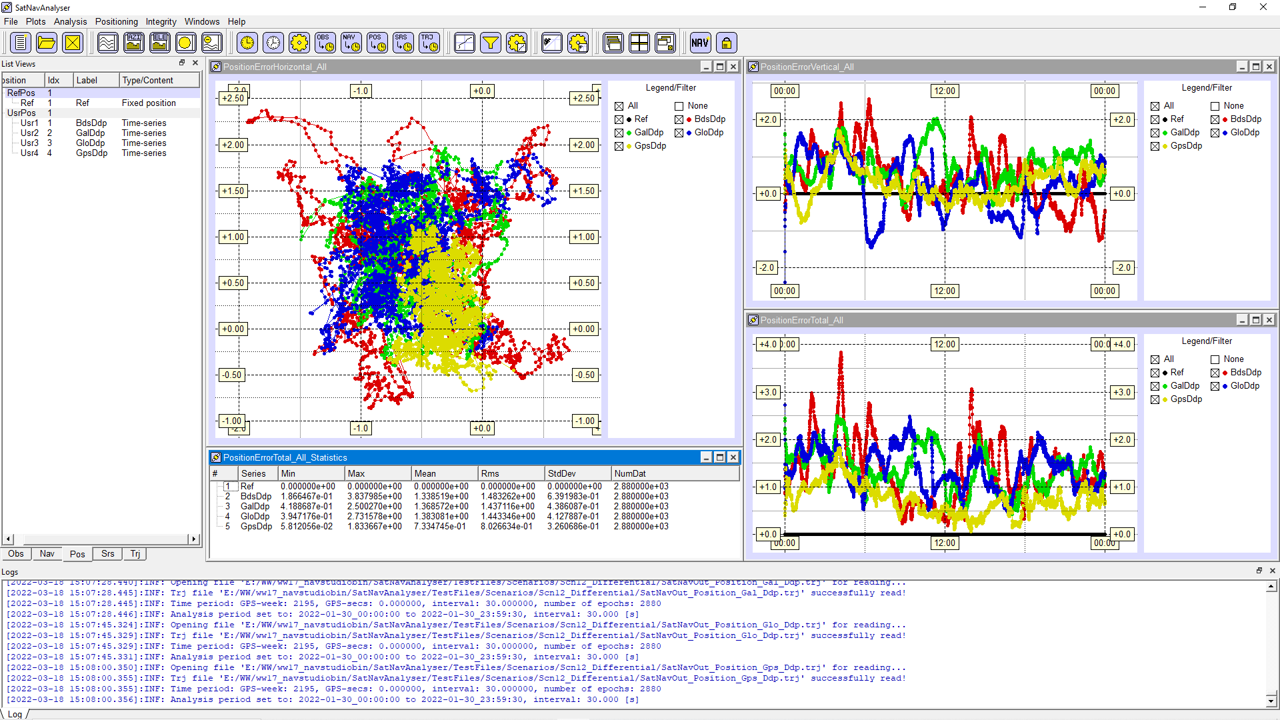
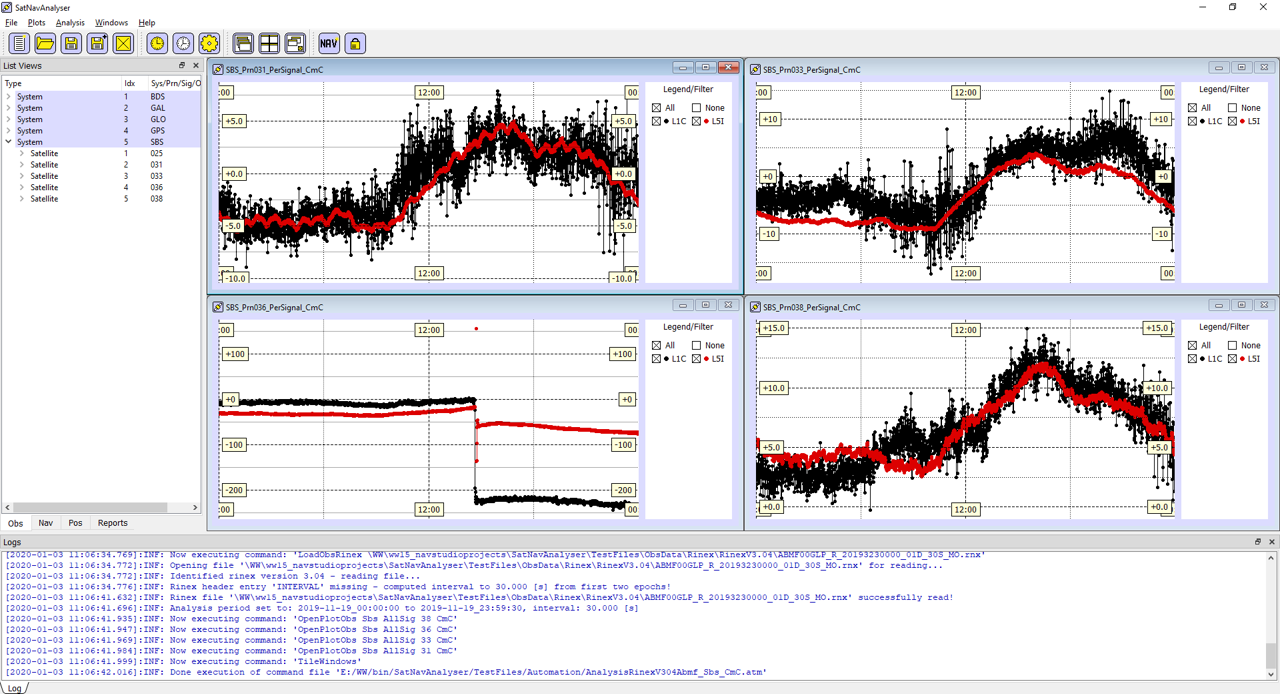
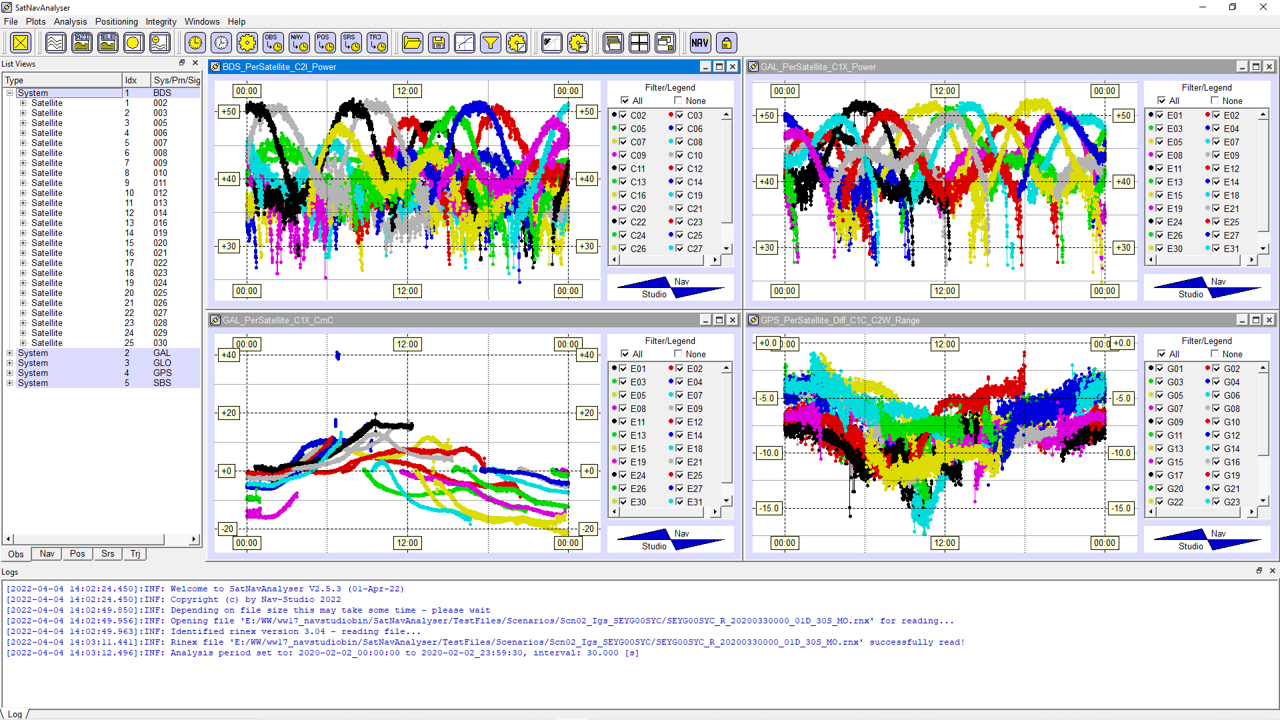
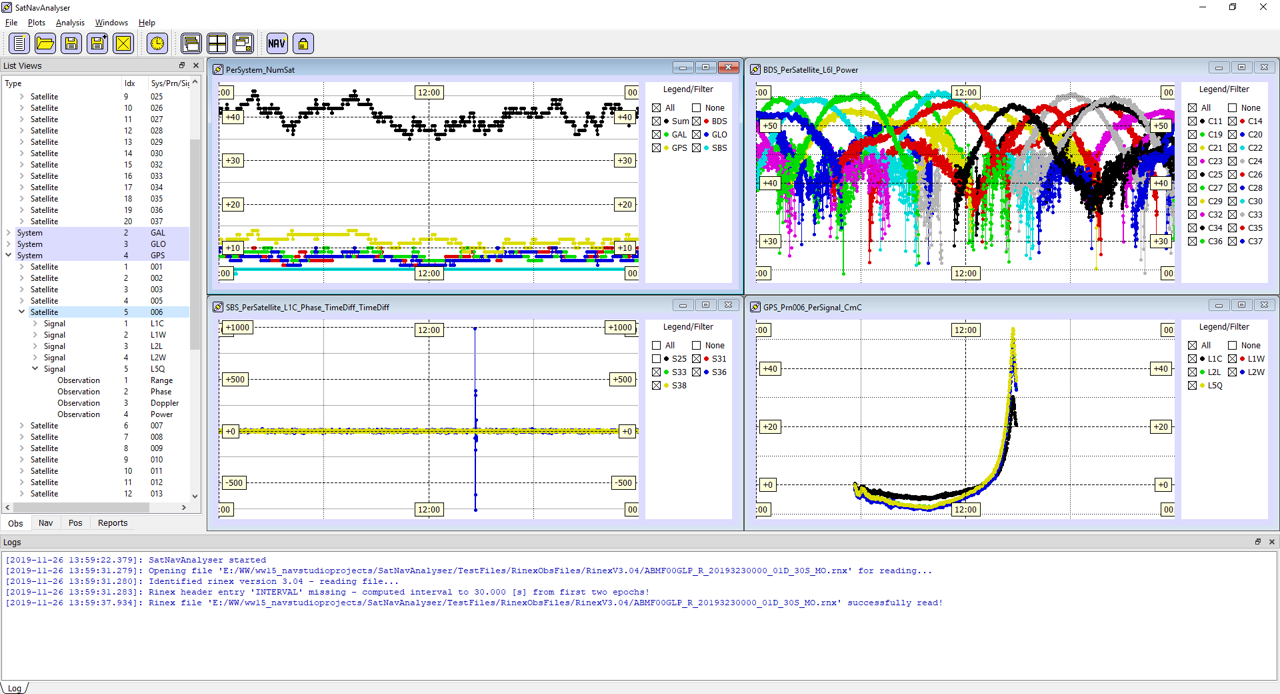
Multi-time-series plots show data of same type of different objects in a single plot. This way, e.g., pseudo-range measurements of several signals of one satellite, or signal powers of a specific signal or a signal component of several satellites can be compared directly. Such comparison analyses are also supported in position domain. Trajectories or position error components can be
viewed as time series or in a two-dimensional horizontal system.
Observation data and their time differences as well as statistics can
also be plotted against azimuth and elevation.
Details
- Support of customized signals
- Support of new observation types in RINEX-Obs files V4.02
- Support of Earth orientation parameters in RINEX-Nav files V4.xx
- Support of system time offset parameters in RINEX-Nav files V4.xx
- Support of LEO observations (pre-RINEX standard)
- Observation data analysis: multi-time-series plots per system, satellite or signal
- Observation data analysis: differential multi-time-series plots per system, satellite or signal
- Observation data analysis: time-series plots of signal combinations, like narrow-/wide-lane or Melbourne-Wübbena
- Navigation data analysis: satellite ground tracks and footprints
- Navigation data analysis: computation of theoretical DOP values over time
- Navigation data analysis: computation of delta positions and delta position components
- Navigation data analysis: display of delta navigation data parameters
- Position data analysis: positioning error computation and statistics (RMS, 2DRMS, 3DRMS)
- Position data analysis: positioning error computation also against a dynamic reference position
- Position data analysis: support of .gpx file format
- Meteo data analysis: display of meteo station information
- Meteo data analysis: display of meteo sensor information
- Meteo data analysis: replay capability for meteo station data
- Meteo data analysis: time-controllable display window for meteo station data
- Ionospheric data analysis: generation of vertical TEC maps
- Ionospheric data analysis: time-series plots of vertical TEC at configurable position
- Service-volume analysis: configuration: satellite constellation, analysis period and time-interval, point grid, minimum elevation
- Service-volume analysis: number of visible satellites, PDOP, HDOP, VDOP, availability
- Service-volume analysis: statistics: computation of minimum, maximum, or mean per grid point
- Integrity analysis: generation of Stanford integrity plots
- Positioning: positioning with Kalman-filter or least-squares approach
- Positioning: filtering against systems, satellites, and signals
- Positioning: estimation of vertical tropospheric delay
- Positioning: positionierung with ionospheric-free observation combinations
- Positioning: output of DOP values and pseudorange residuals
- Positioning: output of observation residuals relative to the estimated or a fixed position
- Positioning: carrier-phase ambiguity resolution
- Positioning: detailed Kalman-filter configurability
- Positioning: estimation of frequency-dependent FDMA HW-biases
- Computation of time differences and integrals from time-series
- Computation of time-series statistics (min, max, mean, stdDev, RMS, numDat, etc.)
- Computation of histograms from single- or multi-time-series
- Computation (and removal) of a per-epoch mean value of time-series
- Export of time-series plots as PNG graphics
- Export of RINEX-obs/-clk/-met data as time-series
- Conversion between different RINEX-obs/-nav/-clk/-met file versions
- Conversion of RINEX-nav data into SP3 file format
- Replay capability for 6DOF trajectories
- Rough orbit determination based on Doppler measurements of one or more reference stations
- Rough orbit determination based on measurements of a ground station network
- Time-controllable display window for 6DOF trajectory data
- Input of receiver position data
- Computation and output of satellite-receiver distances as time-series
- Output of satellite positions over time as trajectory or time-series
- Support of older RINEX-obs file format versions V2.00 and V2.11
Additional Example Screenshots
Development
SatNavAnalyser will be improved and maintained on a long-term basis.
Currently available: SatNavAnalyser V5.0 (2026.04.28)
Please send your request to: contact@nav-studio.de
Last change of this page: 2026.04.29